 Photoview - Photometric and Spectrometric Data Management
General, Visibile, Horticultural and UV fields
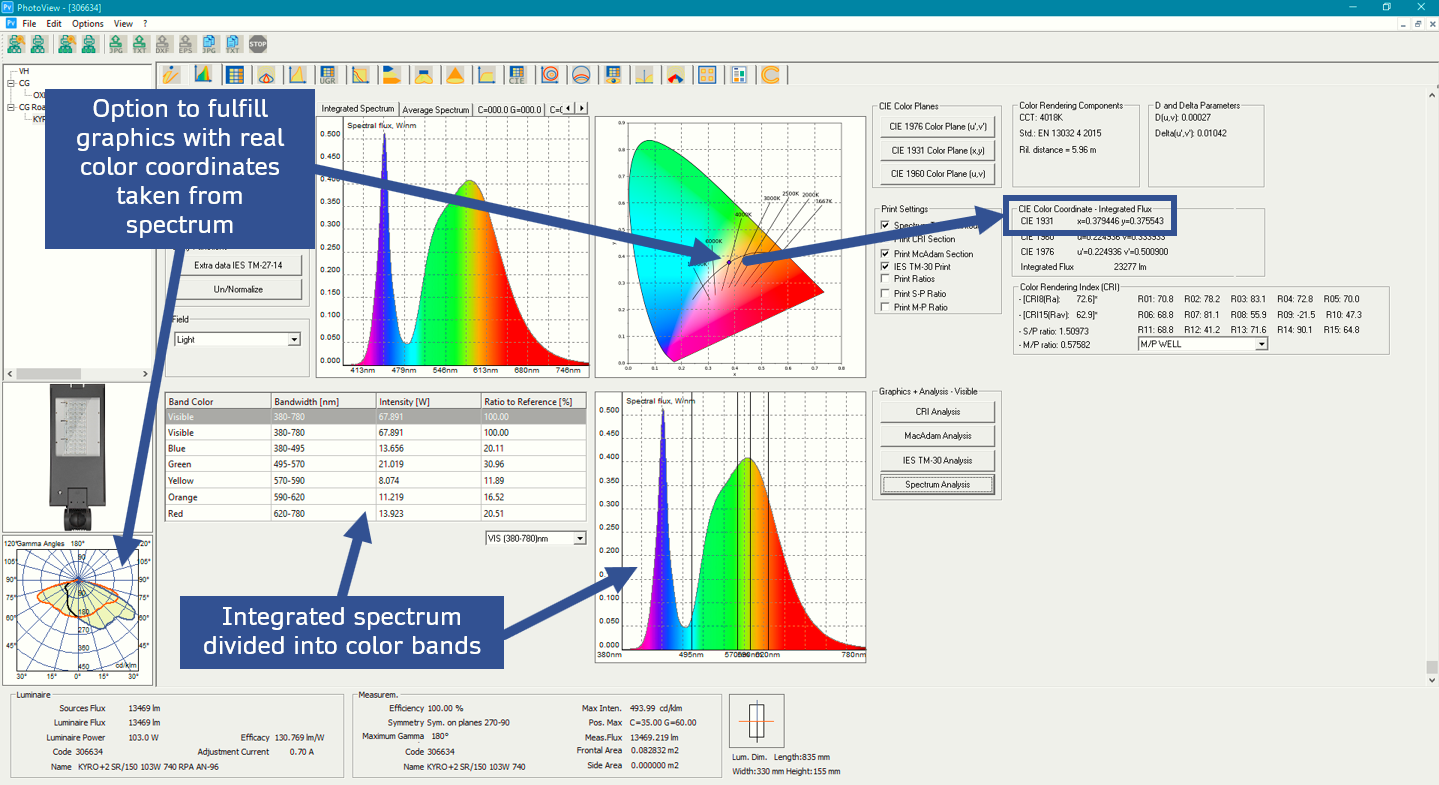
- The option to color the inner area of the polar, Cartesian, photometric volume and beam opening graphs using the color defined by the color coordinates of the integrated spectrum has been added
- Charts and charts regarding the visible field:
- the spectrum graph between 380 and 780 nm with subdivision into color bands (blue, green, yellow, orange and red) has been added
- the table of radiant fluxes by color band with relative percentages has been added
- Charts and charts regarding the horticultural fields in PAR units:
- Spectrum graph in PAR units
- Table of PAR parameters such as PPF (Photosynthetical Photon Flux), YPPF (Yield PPF), YPPF/PPF, R/B Ratio (Red/Blue), Efficacy PAR PPF/W with the possibility of setting the range even outside the canonical 400 -700 nm
- UV graphs and charts in radiometric units:
- Spectrum graph in radiometric units with subdivision into the UVA, UVB and UVC bands
- Chart of radiant fluxes by UVA, UVB and UVC band, of radiant fluxes in percentage and of radiant efficacy
File/Batcher/Dir-to-Dir Function
- The Print Custom function has been added. It allows to print n photometries of n photo-spectrometric files (IES, IESxml, LDT OXL, UNIxml) according to the configuration of graphs and tables defined with the File/Custom Print Settings function
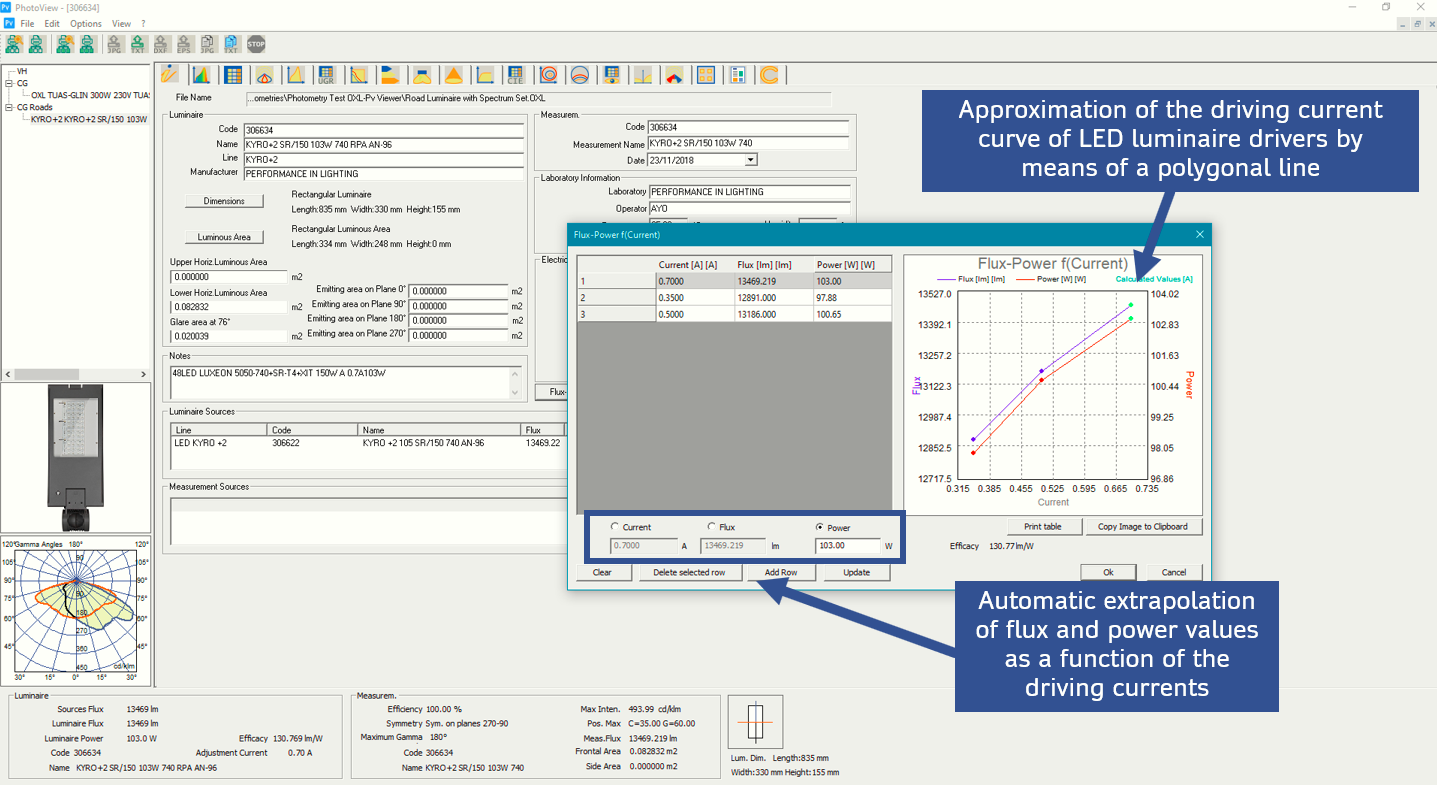
Driving Currents
- The management of the driving currents of the LED luminaires has been completed according to the CEI Guide 34-189 regarding the extension of electrical and photometric measurements for LED lighting luminaires. Now it is possible to save the data of both fluxes and powers according to the currents in a single OXL file
Batcher Plus
- The File/Custom/Batcher Plus function has been added. It allows to:
- generate automatically an Excel file (BEF = Bridge Excel File) in OxyTech standard format from a group of LDT, IES or OXL origin photometries; each line of the BEF file displays the data of a single luminaire taken from its source file
- generate automatically other LDT, IES and OXL files using the Excel BEF file created in the previous point by extrapolating the source files
- The function to export graphics in SVG format typical of the Internet world has been added
- The management of the energy assessment of sources according to EU 2019: 2015 has been added
 Litecalc - Lighting Design and Planning
General
- The new Horticultural (400-700nm) and UV (200-400nm) fields areas allowing to carry out design calculations directly in PAR units and radiometric units without the use of multipliers have been added. The selection is made by extending the Mode Tab
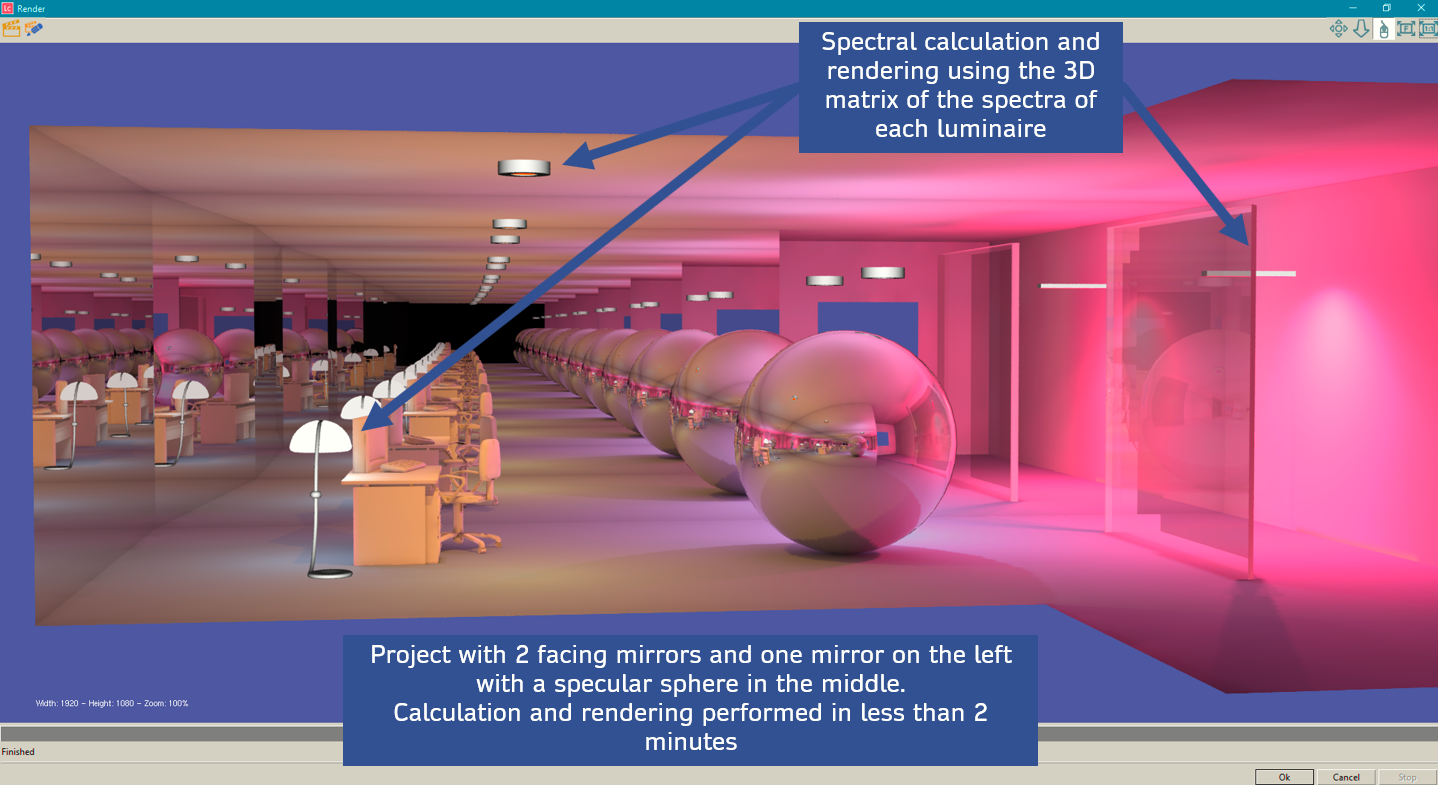
- The calculation and rendering function has been modified to automatically manage the integrated spectrum of the each luminaire to obtain a result no longer only in white light but directly with the light colors of every single luminaire
- The functions for exporting and importing 3D objects in OXF format (OxyTech proprietary format) have been added
- The new management of the Absolute, Relative (Grid) and Object coordinate systems has been implemented
- LED driving currents - The management of the driving currents of LED luminaires has been completed according to CEI Guide 34-189 - Guide for the extension of electrical and photometric measurements for LED lighting luminaires which allows to save flux and power data according to the currents in a single OXL file
- Export Dxf – The export of project, results and graphics in Dxf has been modified: now the program exports luminaires with the same reference as the printouts. Layer management has been reorganized
Calculation and Rendering
- A new calculation and rendering function has been included. It allows to manage, in addition to the calculation with white light (N.B.: this is the calculation obtained by importing an LDT or IES LM-63 file), directly the color of the light emitted by the luminaire. This is possible by importing into the program an OXL file including a 3D matrix of the spectra, allowing to avoid defining the color parameters of the light by choosing an approximate spectrum or color coordinates. Available for both visible, horticultural and UV fields.
Road Plus
- The automatic printing of projects in PDF files has been added
- The management of the project coding has been modified so as to report it automatically in the printed PDF file
Tunnels
- The evaluation of the luminance curve through the L20 method of the CIE 88: 2004 Recommendations has been included
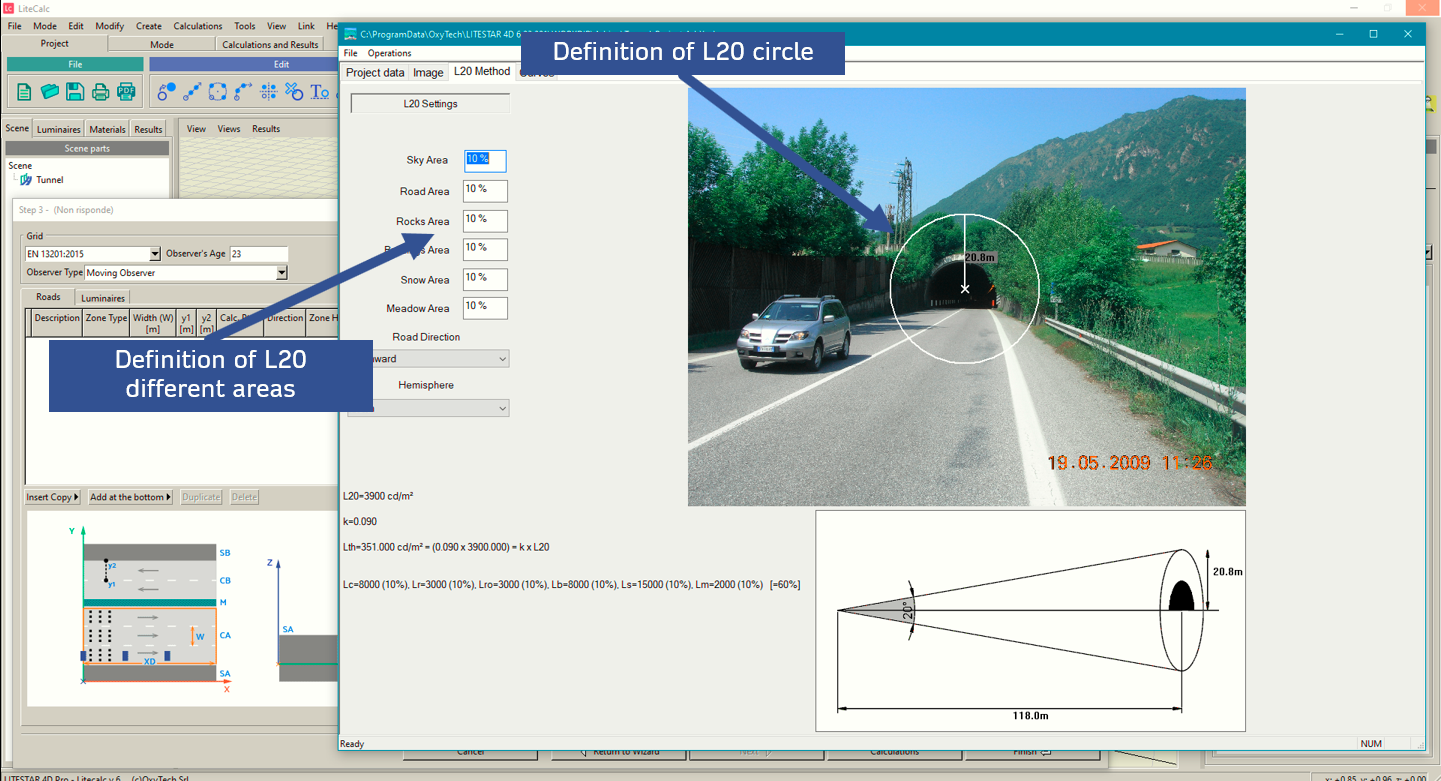
- The list of standards available for determining the luminance curve at the tunnel entrance has been enriched after having included the EN CR 14380-2003 (European Technical Report), OC36215 2015 (Spain) and UNI 11095-2021 (Italy) ones
- Advanced Project for Tunnels Section – Luminaires Tab – the import function of Excel files including numbering, level, luminaire coordinates, photometric file, dimmer and maintenance factor has been added. It is useful for speeding up and automating the management of tunnel projects
- Bug-Fix – The display of results on the walls has been modified by orienting the right wall in the same way as the left one
Printouts
- The Save as Default function has been added. It allows to configure the print list to be used for subsequent projects without the need to reconfigure it
- Tunnels - Complete printout of the results of illuminance, luminance and uniformity by zones of the luminance curve (entrance, transition, permanent, exit) according to UNI 11095: 2021. The function is also available for all other standards
 Liswin - Interactive Electronic Catalog
General
- The management of the UNIxml file has been updated to meet the CAM (Minimum Environmental Criteria) 27 September 2017 with the introduction of corrections as per Errata Corrige UNI 11733: 2019 dated 07/07/2020
- The export and import function of the Excel BEF file for the automatic creation of catalogs has been enhanced
- Bug-Fix – The overlap error of the light sources when importing LDT or IES files which caused the disappearance of the light sources in previously imported luminaires
 Watch the introductory video: