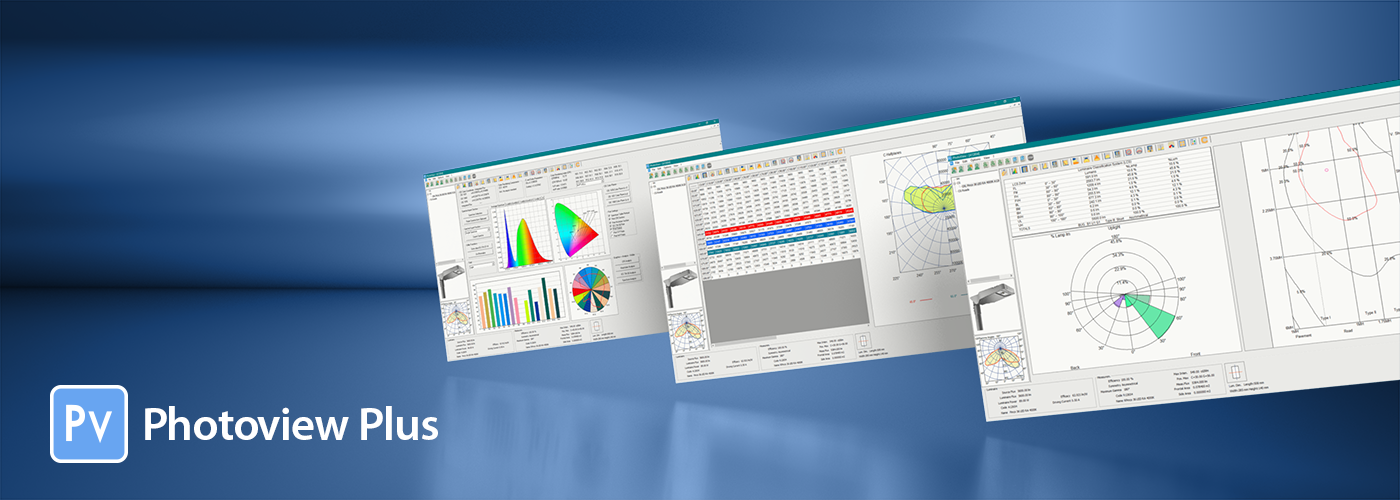
Photoview Plus is the advanced configuration of Photoview, designed for photometry and spectrum management professionals.
It includes the following processing functions:
- of photometric data, including:
- energy efficiency assessment and energy label creation according to EU 2019-2015
- energy labels for the assessment of IPEA* energy efficiency according to Italian Ministerial Decree 270917
- photometric solids in 3D
- beam opening diagrams, both in 2D and 3D
- zonal flux diagrams and photometric classifications BZ, DIN 5040, UTE 121 and CIE
- multiprojection isolux and isocandle curves
- road lighting yield curves according to CIE, IES and EN 13201 and of luminance curves
- road lighting luminaire classifications according to the BUG system (IES TM15)
- SHR diagrams and tables for emergency luminaires
- of the spectrum data (radiometric) in the visible field, including:
- spectrum and CIE 1931, 1960 and 1976 color planes display
- CRI bar and pie charts
- McAdam analysis
- ES TM-30 2015 + EI 2018 analysis
- spectrum analysis for fixed bands and dynamic bands with radiant flux calculation
- import and export of single and matrix spectra (matrix of spectra)
- evaluation of the melanopic/photopic M/P ratio according to Well
- evaluation of the Scotopic/Photopic ratio
For further information consult Report Plus section.
Check the Functions Summary/Photoview section for the detailed list of functions.
Nota Bene - Photoview Plus can be activated by purchasing the Una-Tantum Plus License from the e-commerce section.
How to Save Graphs and Charts
Save your graphs and charts in the following formats:
- Graphs
- Raster formats: BMP, TGA, JPG, PCX, PNG
- Vector formats: Dxf 2D o 3D, Postscript (EPS, PS), SVG
- Charts in TXT or PDF format
Graphs and Charts in a Few Minutes … via Batcher Dir to Dir
All the graphs and tables of Photoview Plus can be managed with the Batcher Dir to Dir function with which, starting from n OXL 8.00 (or LDT, IES but only for what the photometric part is concerned), you can generate n photo-colorimetric reports in the required languages in just few minutes.
 Watch the introduction film about Photoview Plus
References